
Product update
Introducing the Advanced Cycle Index
July 2026 · What's new on the remi Cycle Index
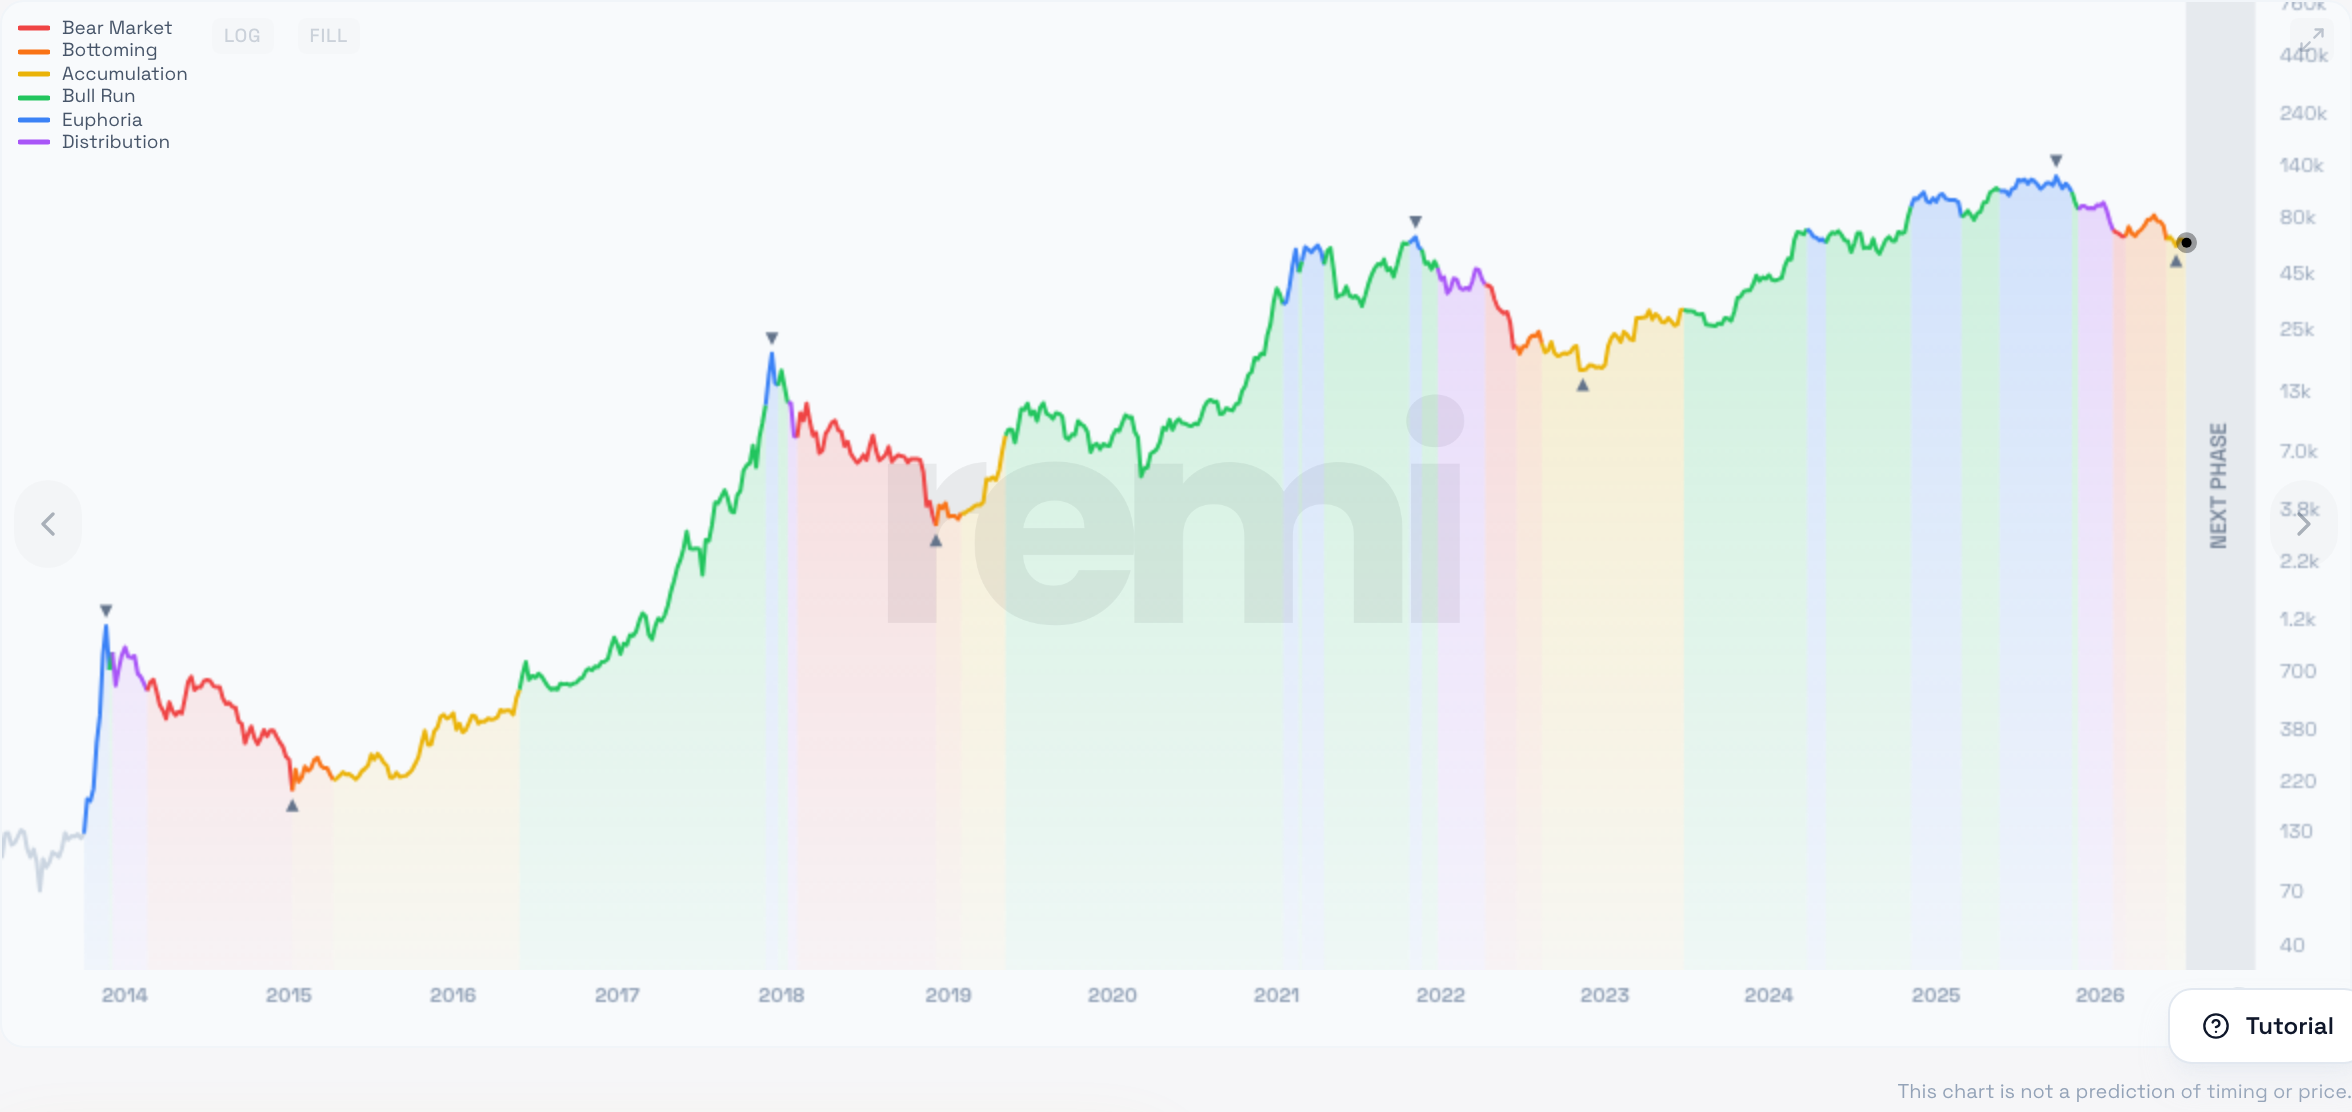
We just shipped the biggest upgrade to the Cycle Index yet. You can now see the six market-cycle phases laid right on top of the actual historical Bitcoin price — every cycle, all the way back to 2013, in a single view. No more illustration standing in for the real thing. This is the real chart, colored by where the market has actually been.
Until now, the remi Cycle Index showed you today's phase and a stylized curve to explain the idea. Useful, but abstract. The new Advanced Cycle Index replaces that stand-in with the genuine article: Bitcoin's price history, each week painted with the phase the market was in — so you can watch the cycle actually turn, over and over, across more than a decade.
Quick honesty up front: nothing here is financial advice — it's an educational tool for reading market context, and everything below is about what it shows, not what to do about it.
What's new
Three things landed in this release, and together they turn the Cycle Index from a snapshot into a story you can explore.
The real Bitcoin chart, phase by phase
The headline feature. Instead of a smooth illustrative curve, you're looking at the true weekly Bitcoin price, and every stretch of it is color-coded by remi's six phases:
- Bear Market — the active crash.
- Bottoming — selling exhausts, a floor forms.
- Accumulation — boring, sideways, range-bound.
- Bull Run — the sustained markup higher.
- Euphoria — the vertical, everyone's-in blow-off.
- Distribution — the top rolls over, the cycle resets.
Seeing them in sequence, on real price, makes the pattern click in a way a single number never could. The 2021 double-top in blue, the long yellow accumulation grind, the green markups — it's the same wheel turning, cycle after cycle.
Every cycle since 2013, on a log scale
The chart opens on a logarithmic scale by default, which is the honest way to view a decade-plus of Bitcoin. On a normal (linear) scale, everything before 2020 flattens into a line hugging zero — the early cycles vanish. On a log scale, a move from $200 to $2,000 takes up the same visual space as $10,000 to $100,000, so every cycle is legible at once. The result is Bitcoin's whole history reading like a staircase, each step a full cycle.
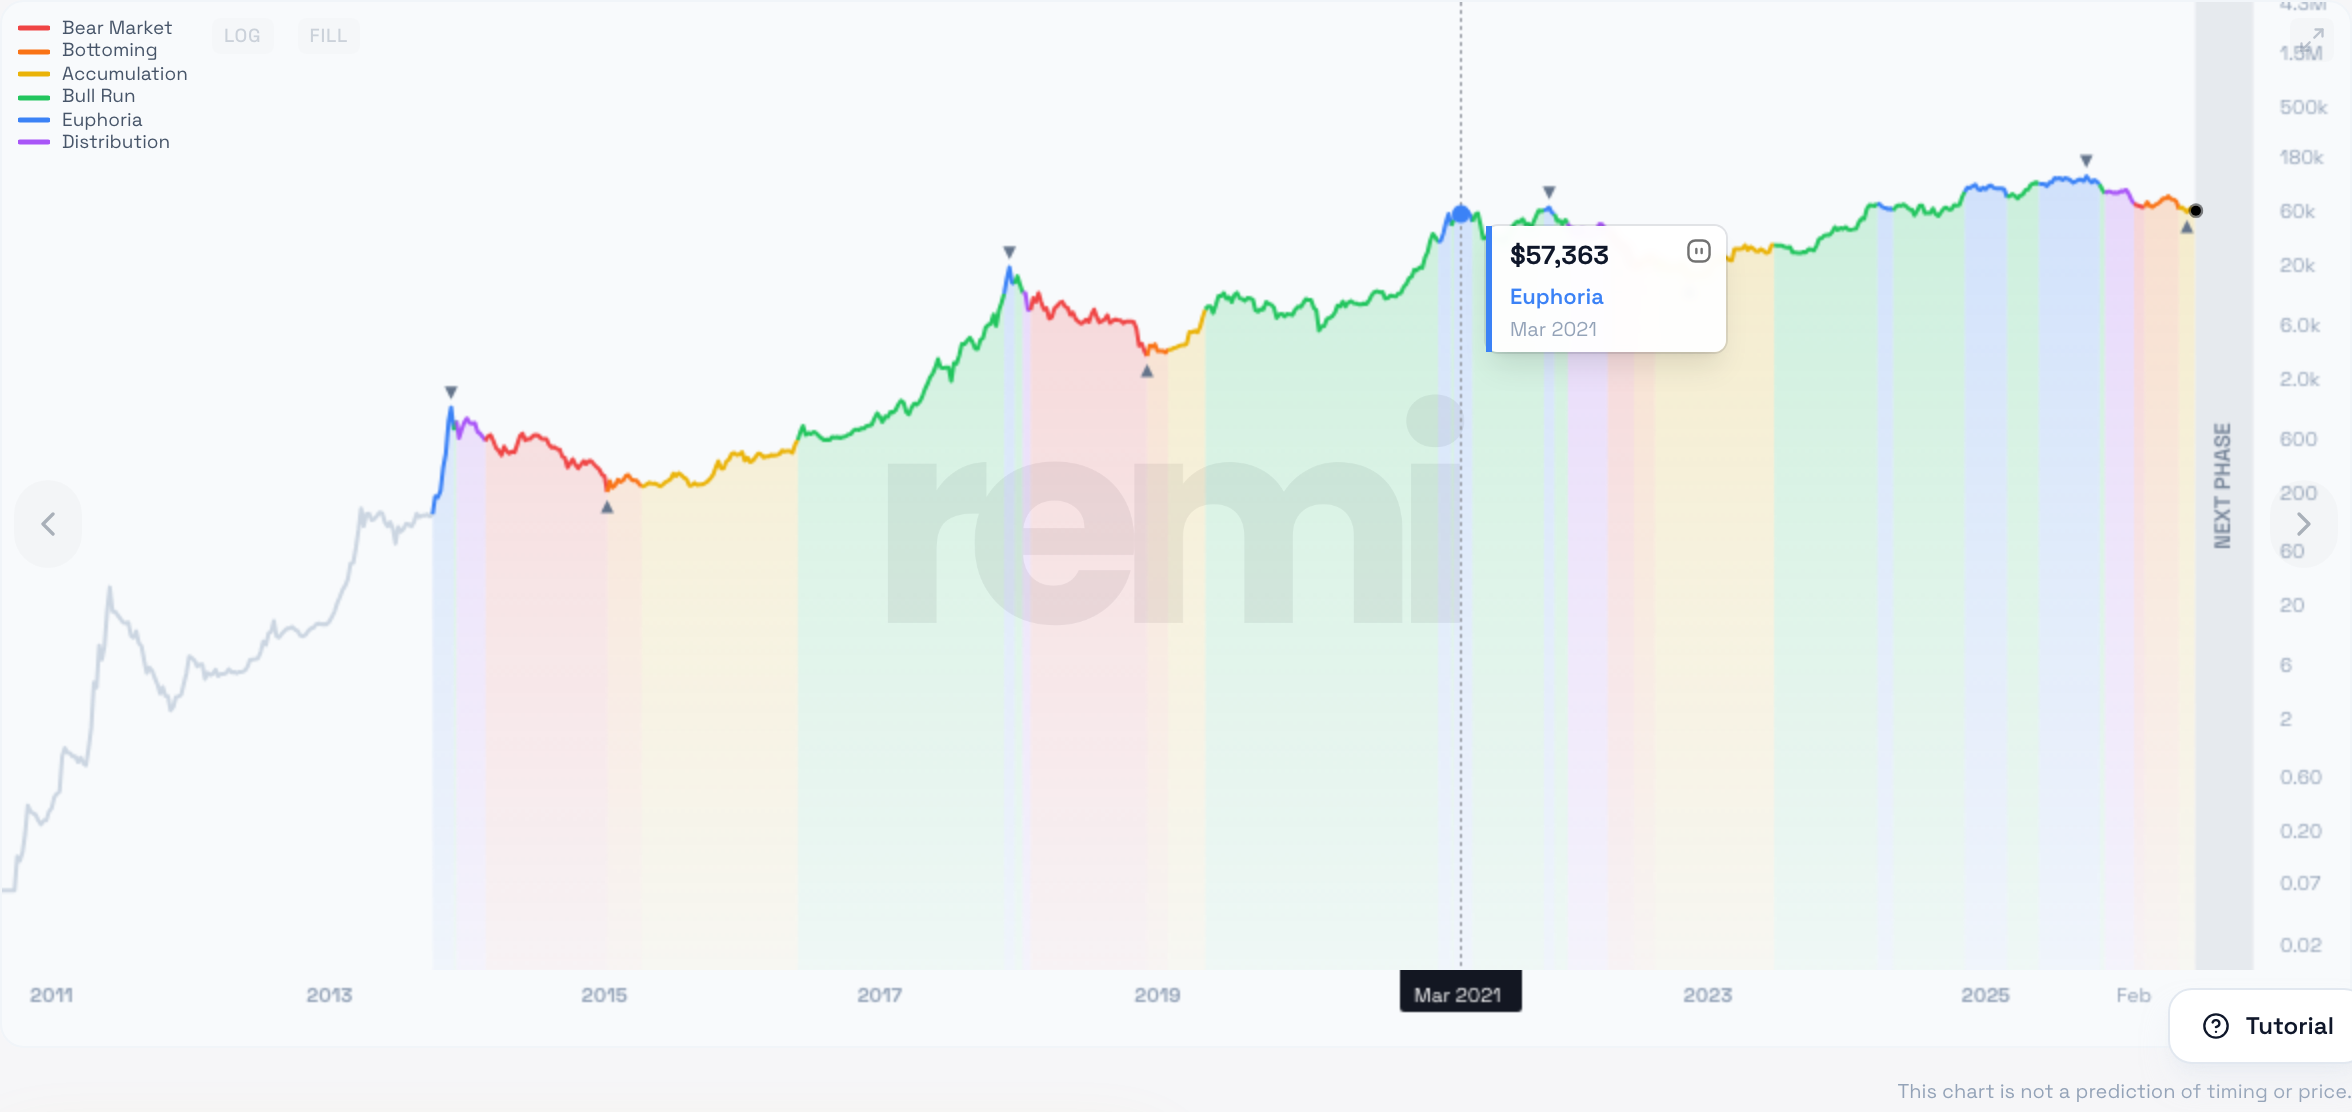
Explore it — pan, zoom, and switch views
The Advanced chart is fully interactive. Pan back through past cycles, zoom into a single one, and toggle between log and linear scale to see the same history two ways. On the right, a shaded band marks what phase typically comes next in the sequence. And if you ever want the simpler, big-picture illustration back, a one-tap Advanced / Simple toggle switches between the two — remi remembers your choice for next time.
See it for yourself
The Advanced Cycle Index is live now. Open it, pan back through a decade of Bitcoin cycles, and see which phase the market is in today. Free to use — set up an account and remi can email you when the cycle phase changes.
Open the Advanced Cycle Index →Educational only. Not a trading signal or a recommendation to buy, sell, or hold.
Why we built it
The whole point of remi is to take the emotion out of reading the market and replace "how do I feel right now?" with "where are we actually in the cycle?" A single phase label does that for today. But people learn the cycle by seeing it repeat — the same shapes, the same handoffs from one phase to the next, over and over. That's hard to internalize from an illustration. It's obvious the moment you watch it play out on real price.
So the Advanced Cycle Index isn't just prettier — it's a better teacher. When today's phase reads "Accumulation," you can now scroll left and see every previous accumulation on the real chart: how long they dragged on, how boring they felt, and what came after. Context you can see beats a label you have to trust.
How to read it
A few pointers to get the most out of the new chart:
- Start zoomed out. The default log view shows every cycle at once — the best way to feel the rhythm before diving into any single one.
- Follow the colors, not the price. The story is in the sequence of phases, not any one candle. Watch how Euphoria (blue) reliably gives way to Distribution (purple), then the Bear Market (red).
- Hover or tap to read a moment. The crosshair names the price and phase at any week, so you can check exactly where a past top or bottom fell.
- Check the "next phase" band. On the right edge, it shows what typically follows the current phase in sequence — order, not a prediction of timing.
New to the phases themselves? Our companion pieces walk through what a bear market actually is, how to tell if a bull run is over, and when the next bull run tends to arrive — all readable straight off the new chart.
What it isn't
Worth saying plainly: the Advanced Cycle Index is an educational read on market context, not a crystal ball. Coloring past price by phase shows you where the market has been — it doesn't promise where it's going, and past cycles don't guarantee future ones. The "next phase" band shows the usual order of phases, not a forecast of when (or whether) the next one arrives. It won't tell you to buy, sell, hold, or time anything. It just makes the shape of the cycle visible so you can keep some perspective.
Common questions
What is the Advanced Cycle Index?
It's the real Bitcoin price chart on remi's Cycle Index, with every stretch of history color-coded by the market phase it was in — Bear Market, Bottoming, Accumulation, Bull Run, Euphoria, or Distribution. It replaces the earlier illustrative chart with actual price, going back to 2013.
What's the difference between the Advanced and Simple charts?
The Simple chart is a stylized illustration of the cycle's shape — clean and abstract. The Advanced chart is the genuine Bitcoin price history, colored by phase. A one-tap toggle switches between them, and remi remembers your choice.
Why does it open on a log scale?
Because it spans more than a decade of Bitcoin. On a linear scale the early cycles collapse into a flat line near zero; a logarithmic scale gives each cycle equal visual weight, so the whole history is readable at once. You can switch to linear anytime.
Is it free?
Yes. The Advanced Cycle Index is free to use at remi.circadia.ai/cycle. A free account lets remi email you when the cycle phase changes, so you don't have to watch the chart.
Not financial advice
remi is an educational market-intelligence tool. Nothing on this page is investment, financial, legal, or tax advice, and nothing here is a recommendation to buy, sell, or hold any asset. Use remi as educational market context, not as personalized financial advice. Cryptocurrency is highly volatile and carries significant risk, including the risk of total loss — always do your own research and consider speaking with a licensed professional before making any decision.
Last updated: July 2026 · Cycle Index · Privacy · Terms